What is Website Heatmapping?
Website heatmapping - or “heat mapping”, or “heat-mapping” (depending on the circle you run in) is simply a way for you to track how visitors are using your site. In some instances you can actually record how their cursor moves around on a page, or let you see what a customer clicks on, or monitor whether or not they are interested enough in your content to scroll down and read more than what loads up above the fold.
Heatmapping allows you to learn more about the behavior of your website visitors, and if your website is actually performing as intended.
If you have a website and you’ve noticed that you’re pulling some traffic, you’re going to want to know what that traffic is doing - or not doing (especially if it’s paid traffic).
Recently I ran a paid ad campaign on Facebook that didn’t do well. Er… I should rephrase that… it did OK, but it didn’t do GREAT. When the campaign ended I tried to learn more about how people interacted with my site and quickly realized I had no way to see anything more than “visits”. That’s a vanity metric.
We all need data that actually helps us make decisions that have an impact on the bottom line. So, if you’re like me and you want to learn more about your visitors - let’s get into heatmapping!

Today we’re going to do a free installation of Hotjar, a popular heatmapping tool with some other cool features. I have no affiliation with this service, but have wanted to try them out for a while now. At The Hauser Design Group we actually use Crazy Egg, which is a great option... but… they don’t have a free plan, and we are trying to keep this initial series of marketing efforts SUPER SIMPLE, and SUPER INEXPENSIVE so that they are accessible to everyone. Once you’ve applied and absorbed the concepts we can go buck wild with bigger budgets for bigger returns. Make it rain!

Prerequisites:
We are going to assume that you have a good product or service.
We are going to assume that you have some sort of website.
We are going to assume that you have some website traffic, either paid or organic.
Now just like last time, these things need to be present, not perfect. Hell, if they were perfect, we wouldn’t even be going through these exercises, would we? Don’t fall into analysis paralysis. Move.
Remember: with every round that we complete, our goal is to improve. Even small improvements are worthwhile and a valid use of our time.
You probably remember that my primary product is a 1-hour consulting call that helps website owners get on the right path while providing direction and guidance towards fixing their website, their business, or in some cases - both. I’m still going to promote this, but I’d also like to know what my traffic is doing so I can fix trouble areas on my site - that’s a goal. Let’s solidify that.
Goals:
Goals are necessary so we can measure success and failure. Right now, mine are simple:
I want to see what my website visitors are interacting with
I want to identify trouble areas on my site
When I run my next ad campaign, the goals will be somewhat similar to what they were when we ran our first Facebook ad campaign to promote the new homepage. These were a bit more involved than the ones above, but after running that campaign I learned that not knowing what my website visitors were doing severely hampered my ability to make decisions in terms of what to do next. So, I need to add that feature to my website - however, I have a few limitations.
Limitations:
The solution must be cost effective or free to start
The solution must be easy to install
So you’re asking the logical question: why were these limitations selected?
Well, we need to find an inexpensive solution to start, because we’re trying to make this initial series accessible to everyone and our budget is only $99. Small sites need this data but they don’t want to pay for it right out of the gate (obviously if your site is already getting thousands of visitors, pony up, it’s worth it). The most important thing right now is to soak up the concepts, apply them and test your site. Once you see a return, boost that budget - but not before you understand what is really happening on the front end, the back end, and with your ads and traffic.
We also need to find a solution that is easy to install, because hiring a developer for this task would eat up our budget.
I have found an option that I think will meet these criteria, so before I over-analyze anything else I’m going to jump in. Remember, making yourself take constant steps forward - even little ones - is so important.
Just. Start. Evaluate. Improve. Repeat.
The Plan:
So, the plan here is simple. First, I’m going to create an account on the Hotjar website. I have no affiliation with them at this time, but I have confirmed that they have a free, basic plan:

Then, I’m going to poke around the dashboard a bit and snag the script that I need to install heatmapping on my website. The script is the piece of code that will make it actually work.
Hey good news - I recorded this part and you can view the installation here:
Once that’s done, I’m going to monitor organic traffic for a bit, then turn around and send out another ad campaign that is similar to our first one with some modifications.
The Tools:
My website (Squarespace)
The heatmapping service (Hotjar)
We will be installing Hotjar to monitor the traffic to my Squarespace website, however, the concepts could apply to websites built on almost any platform, and even those built without a platform - provided you have some sort of access to the code.
Key Targets:
For this upgrade, we’re not going to be targeting a specific customer type or location, we are simply trying to monitor all traffic that hits our website. The goal is to learn more about this traffic so we can present the information they seek faster, and make the overall experience better for them - and more profitable for us. We do this by watching their behavior, and trying to identify trouble areas.
The Results:
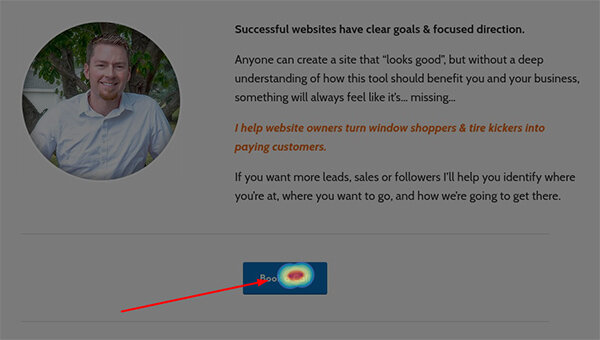
After installation, I had a heatmap set up in minutes. This showed me pretty quickly that people were in fact clicking the “Book a Call” button - check it out:
Next Steps:
With heatmapping in place, I’m ready to run another round of ads, and we learned last time that there was a lot of room for improvement! So before we run the same ad, we’re going to pinpoint a few trouble areas to fix, which we will discuss in the next article. In the meantime I’ll also continue to monitor organic traffic (meaning traffic that comes straight from Google search results) that is interacting with my website.
This is what you should be doing as well.
Here is a quick example showing 1 week of organic traffic that I collected information on passively while I was creating the new ad campaign. This was useful because I didn’t have to manually do anything:

Even if you are not running paid campaigns, passively monitoring the behavior of website visitors will at least give you some data to reference when you are ready to improve your site.
Install a tool like Hotjar along with other free services like Google Analytics and Webmaster Tools. You will appreciate the data when you need it.
Check out the video I linked to and try it for yourself. Let me know how it goes!
A new YouTube Playlist for this series of tests can be seen here.
I’ll keep sharing both success and failure along the way.
Make sure to sign up for email updates as I continue to build an audience.
Now… let’s get ready for our next round of ads…
🍻 Cheers, - AJ

Interested in working together? Sounds great!
I help website owners like you turn window shoppers & tire kickers into paying customers. I’m also a partner and Senior Design Lead at The Hauser Design Group where we focus exclusively on premium website development.